inf-428-data-analytics-online
Distributions and Confidence Intervals
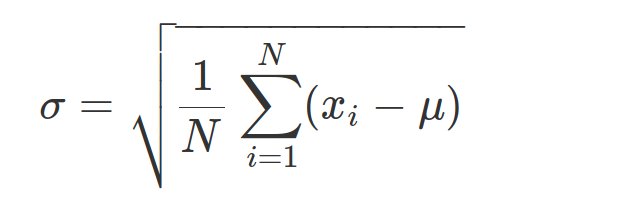
Normal Distribution
- a.k.a. Guass, a.k.a. Bell Curve
- many measurements define the normal distribution
- defined by mean and standard deviation and calculated as follows

Generating Normal Distribution
see notebook
Confidence Interval
- Range of values defined so that there is a specified probability a value lies within it.
- ie 95% confidence interval is a range of values that we are 95% certain contains the value.
- Confidence interval can be calculated from mean and standard deviation of a distribution.
For example in Python the following code calculates the confidence interval of a single draw from a distribution with given mean and standard deviation
import numpy as np
import scipy
test = np.array([1,2,3,2,1,4]);
scipy.stats.norm.interval(0.95, test1.mean(), test1.std())
CONFIDENCE INTERVAL OF THE MEAN
- A mean calculated from sample data has an error itself
- Often we are interested in quantifying this error with a confidence interval
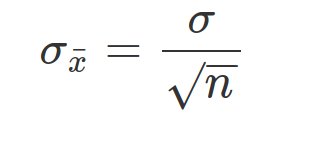
- In this case we need a statistic that estimates the deviation of the mean
- This is called standard error.
Standard deviation vs standard error
- standard deviation measures how far datapoints are from average
- standard error measures deviation of the mean
Confidence Interval of the Mean in Practice
- Range of values defined so that there is a specified probability the mean of the distribution lies within it.
- ie 95% confidence interval is a range of values that we are 95% certain contains the mean.
- Confidence interval can be calculated from mean and standard error of a distribution.
In Python
# in Python
import scipy
# assume a is an array
sample_mean=np.mean(a);
standard_error=scipy.stats.sem(a)

scipy.stats.t.interval(0.95, len(a)-1, loc=sample_mean, scale=standard_error)