inf-428-data-analytics-online
Hypothesis Testing In Practice
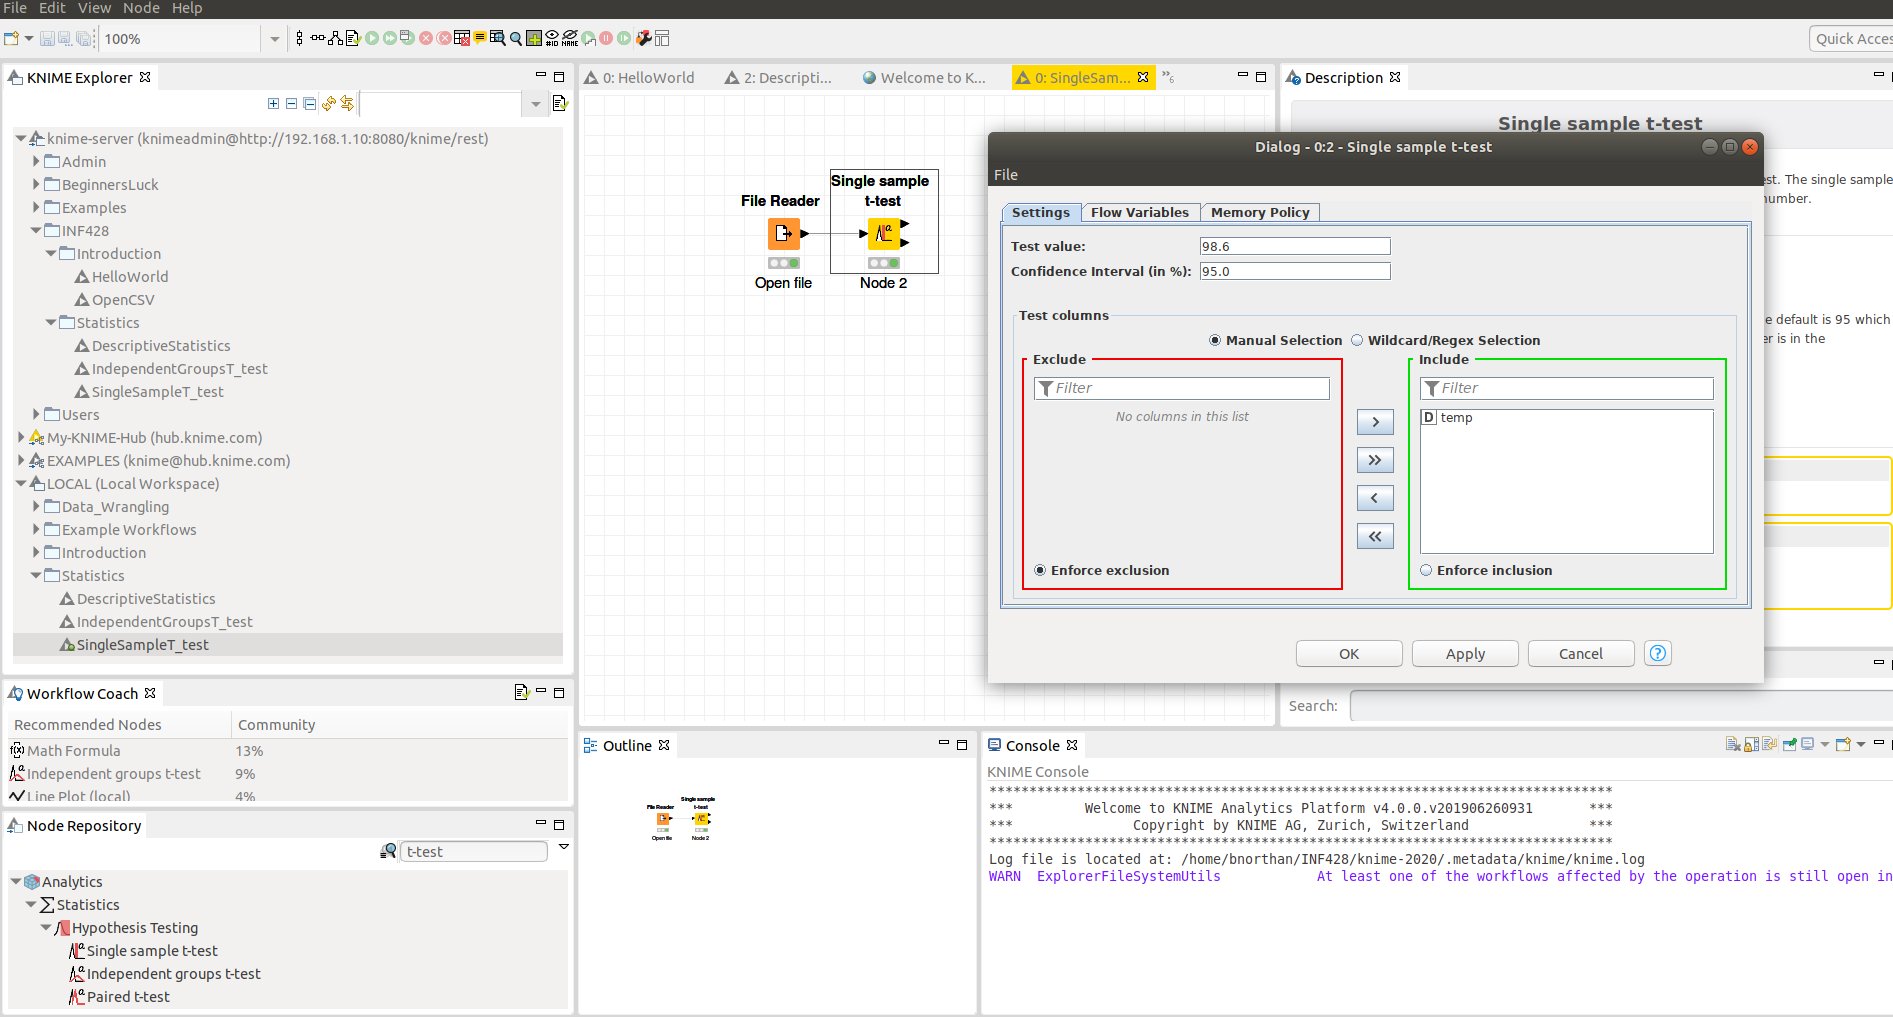
Single Sample t-test in KNIME
See example Statistics->SingleSampleT_test on the KNIME Server
- Search for t-test in the node repository
- Configure t-test with “test value” and choose the column to test
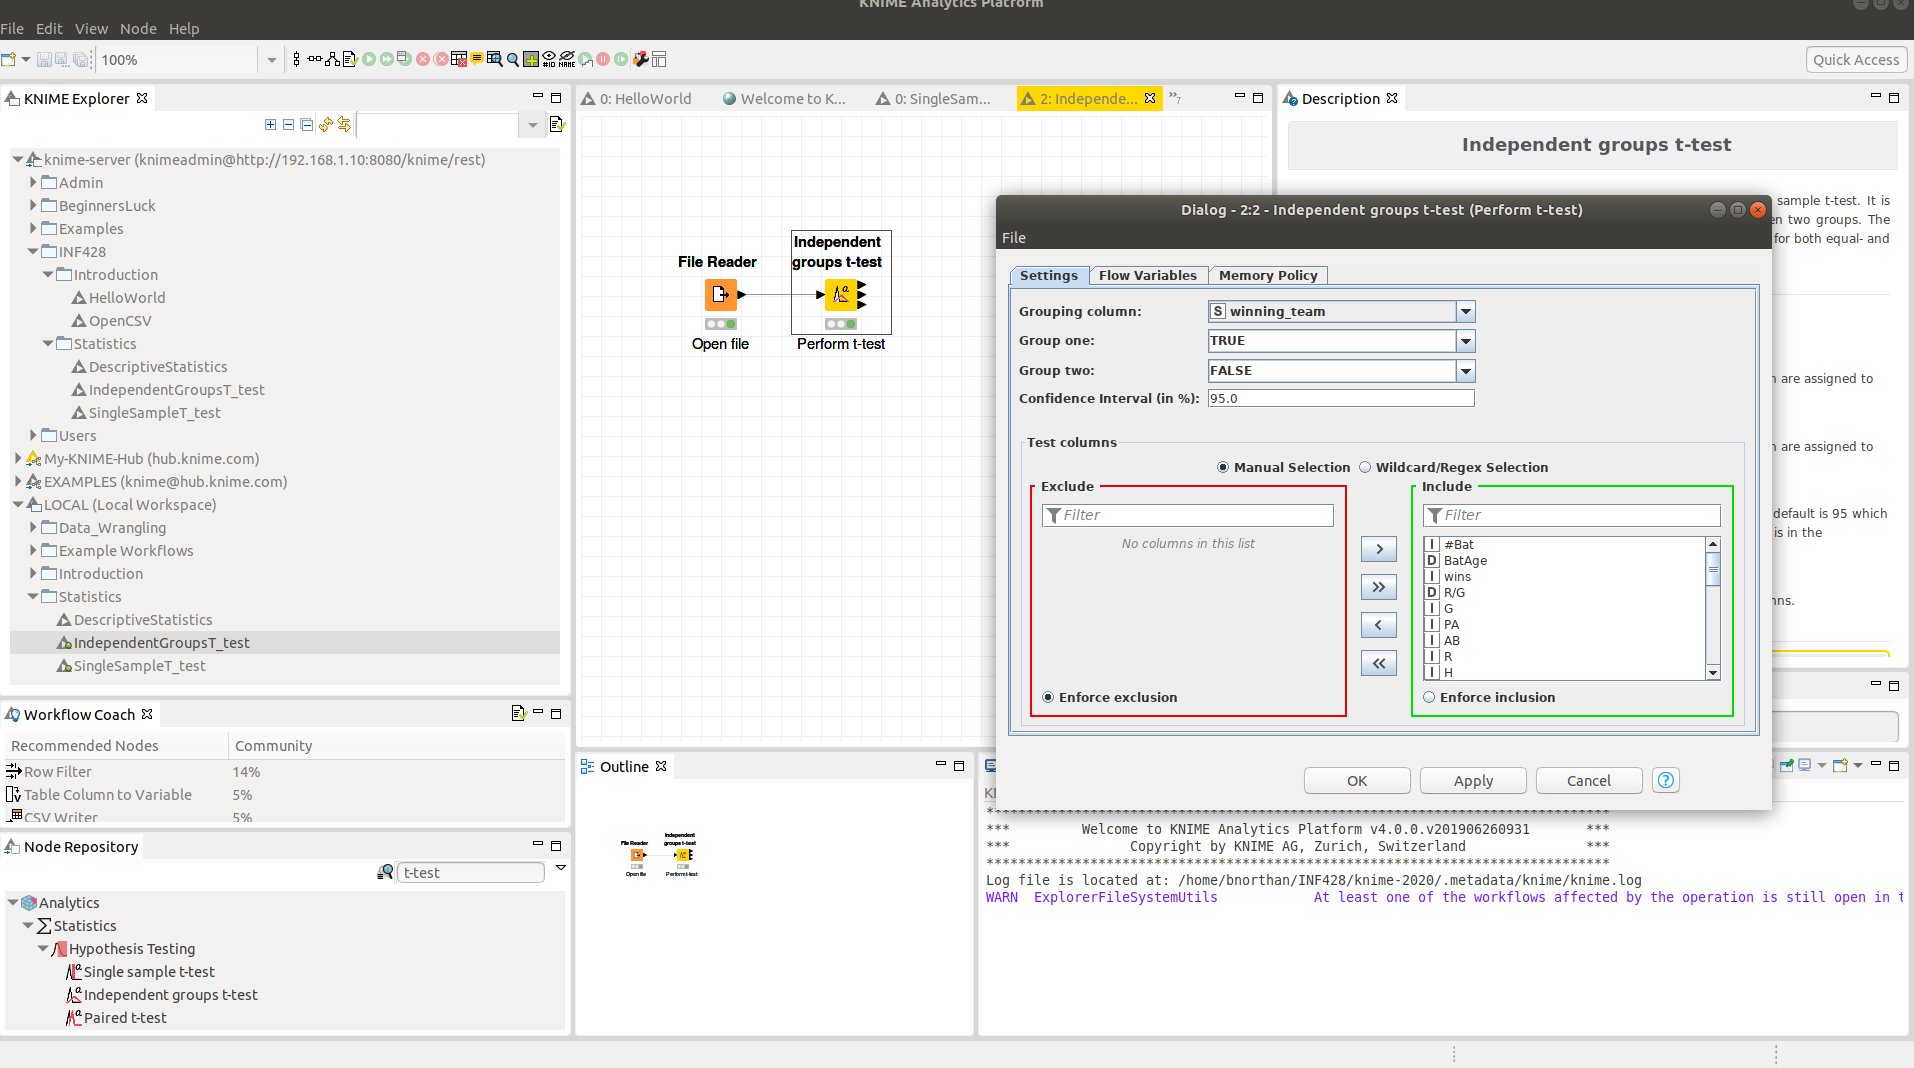
Independent Groups t-test in KNIME
See example Statistics->IndenpendentGroupsT_test on the KNIME Server
- Search for t-test in the node repository and import the node into your workspace.
- Right click on the node to show the node menu and choose ‘Configure’ t-test with Grouping Column and names of group 1 and group 2
- note you may have to open the data in a spread sheet and re-organize data so that it has a ‘label’ column. A label collumn contains the label for the groups. For example if the groups are dog and cat and the name of the group is type the table may look as follows
| Name | Weight | Type |
|---|---|---|
| Fluffy | 33 | Dog |
| Claws | 15 | Cat |
| Smokie | 45 | Dog |
| Mr. Big | 9 | Cat |
Single Sample t-test in Python
See this example
The test can be run, by first importing data using the Pandas library, then passing the data and the value to be tested to the scipy independent t-test function
import scipy.stats
import pandas as pd

temps=pd.read_csv("temps.csv")
scipy.stats.ttest_1samp(temps, 98.6)
Independent groups t-test from stats
This test is used when we have statistics from 2 groups and we want to test if there is a difference between the groups.
The documentation can be found here
A good (and relevant) example is a vaccine trial. See this example
Independent Groups t-test in Python
This test is used when we have data from 2 groups as a list. For example a list of weights of a group of people who are on a special diet and those who are not, and we want to test if there is a difference between groups.
See this example here
(Also look at this detailed example) which shows the data wrangling needed to get the data into the right format.
Once we have two dataframes representing the two groups the python code is as follows
import numpy as np
import pandas as pd
losers=pd.read_csv('losers.csv')
winners=pd.read_csv('winners.csv')
import scipy.stats as stats
# perform t-test on wins column
stats.ttest_ind(losers.wins,winners.wins)