inf-428-data-analytics-online
Introduction
Tools
There is an incredible number of tools for visualizing data. Some are listed below.
- excel
- Tableau
- KNIME with JavaScript
- ggplot (R)
- D3.js (javascript)
- Python via Matplotlib
- Python via Pandas
- mpld3
In this class we will focus in KNIME, Matplotlib (Python), Pandas (Python) and MPLD3 (Python)
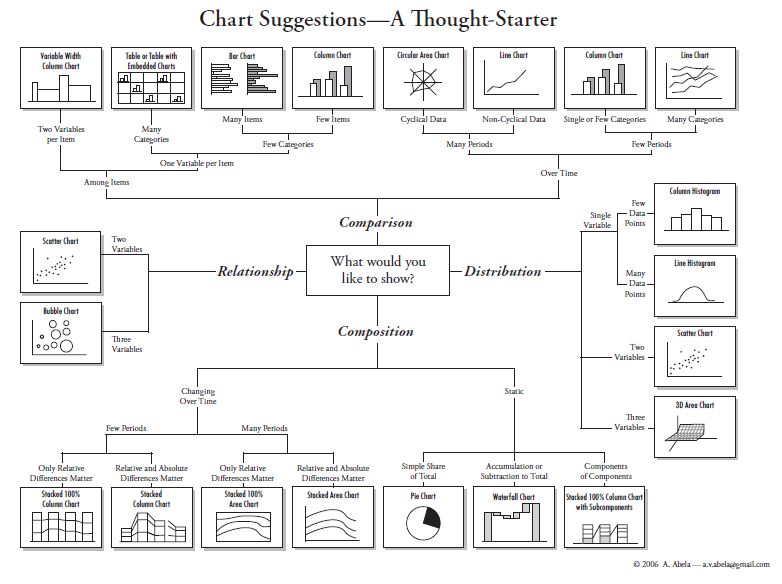
Chart Suggestions
The below chart is useful as a thought starter. First think about whether you are plotting a comparison, relationship, distribution, or composition. Then follow the flow chart.